
Isolation and analysis methods of extracellular vesicles (EVs)

Abstract
Extracellular vesicles (EVs) have been recognized as an evolving biomarker within the liquid biopsy family. While carrying both host cell proteins and different types of RNAs, EVs are also present in sufficient quantities in biological samples to be tested using many molecular analysis platforms to interrogate their content. However, because EVs in biological samples are comprised of both disease and non-disease related EVs, enrichment is often required to remove potential interferences from the downstream molecular assay. Most benchtop isolation/enrichment methods require > milliliter levels of sample and can cause varying degrees of damage to the EVs. In addition, some of the common EV benchtop isolation methods do not sort the diseased from the non-diseased related EVs. Simultaneously, the detection of the overall concentration and size distribution of the EVs is highly dependent on techniques such as electron microscopy and Nanoparticle Tracking Analysis, which can include unexpected variations and biases as well as complexity in the analysis. This review discusses the importance of EVs as a biomarker secured from a liquid biopsy and covers some of the traditional and non-traditional, including microfluidics and resistive pulse sensing, technologies for EV isolation and detection, respectively.
Keywords
An Erratum is published on 15 Sep 2021. You can check it here.
INTRODUCTION
Biomarkers secured from a liquid biopsy are generating significant interest in the research and medical communities due to the minimally invasive nature of acquiring them and the fact that they can enable precision medicine, which seeks to manage a variety of diseases using molecular signatures unique to the patient[1,2]. EVs are one of the many liquid biopsy markers that can be secured from a clinical sample, such as whole blood, saliva, urine, and cerebral spinal fluids.
Biological cells release vesicles of varying sizes through both the endosomal pathway or budding/blebbing from the plasma membrane. These vesicles are known by different names, including microvesicles (MVs), exosomes, and apoptotic bodies,which are collectively called EVs[3] [Figure 1A]. The particular subtype classification of EVs is based on their cellular origin and biogenesis[4]. MVs are heterogeneous, membrane-bound vesicles generated by budding/blebbing from the plasma membrane[5], and range from 100 nm to 1 µm in size. On the other hand, exosomes are the smallest category in the EV family with sizes ranging from 30-150 nm and are released into the extracellular environment after the fusion of late endosomes/multivesicular bodies with the plasma membrane. Finally, apoptotic bodies are generated due to programmed cell death called apoptosis, and range from 1-5 µm in size. Figure 1B shows the size variations of the different types of EVs[6].
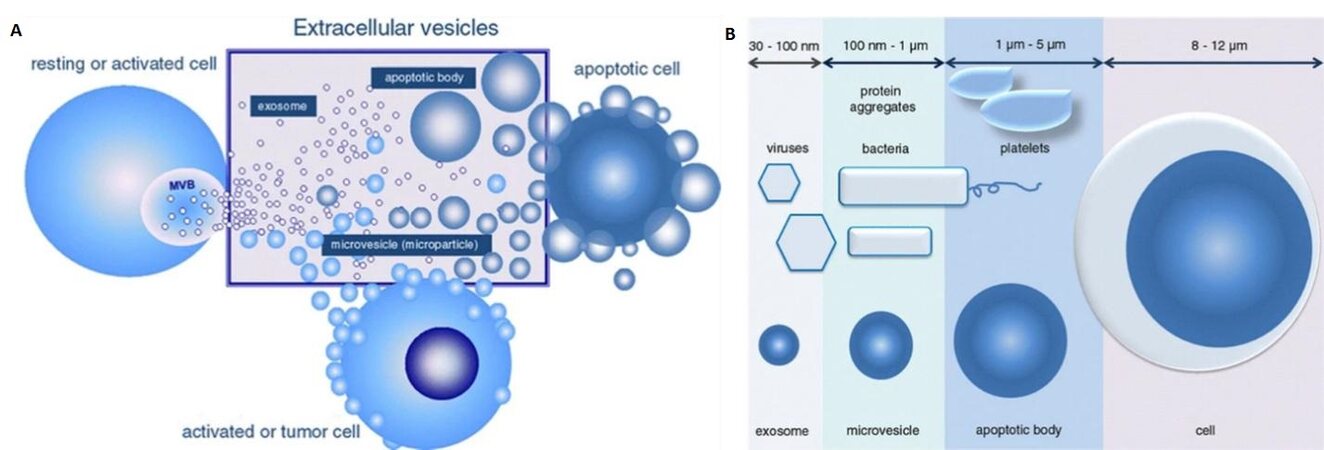
Figure 1. (A) Sub-types of extracellular vesicles including microvesicles, exosomes, and apoptotic bodies. (B) Size ranges of the three sub-types of extracellular vesicles of which exosomes are the smallest with a range from 30 to 150 nm. Microvesicles range from 100 to 1000 nm in size, but the size ranges from 100 to 400 nm when they are present in the circulatory system. Apoptotic bodies range from 1 µm up to 5 µm in size (Reproduced from[10]).
EVs contain variable components including lipids, carbohydrates, cytokines, proteins, and nucleic acids, in particular RNAs[7]. Both the surface and intra-vesicle material of EVs originate from their host cells making EVs suitable biomarkers for disease management, such as diagnosis, monitoring response to therapy, and determining disease recurrence[6]. However, before analyzing EVs they must typically be “enriched” from the clinical sample because they are typically a vast minority in a mixed population.
There is now a pressing need to “enumerate” EV biomarkers and analyze their molecular contents to provide relevant information for disease detection and management. The challenge with liquid biopsy markers is the mass limits they imposed on the molecular assay. Even though EVs are high in numbers (106-1013 EVs per mL of plasma), their small size limits the molecular content within a single EV. For example, a 150 nm (diameter) EV may contain approximately 10,000 nucleotides of nucleic acids. In addition, components present in a sample may interfere with the molecular processing, and enrichment can obviate this issue.
Enrichment and detection techniques can take advantage of either the physical properties of the EVs (size, density, electrical properties, and morphology) or their biological properties (antigen expression). The next few sections will focus on reviewing EVs’ physical properties, intra-vesicle contents, diagnostic and therapeutic applications, isolation methods, and direct detection methods.
TYPES OF EVS
Microvesicles
Microvesicles are heterogeneous, membrane-bound vesicles that are 100 nm to 1 µm in size and are released from the surface of many cell types, including embryonic stem cells, neurons, and astrocytes, under both physiological and disease conditions[8]. MV biogenesis takes place through direct outward blebbing and pinching of the plasma membrane[8]. Platelets, red blood cells, and endothelial cells have been verified as a significant source of MV secretion, and tumor cells also constantly release MVs[9,10]. MVs are important in altering the extracellular environment, intracellular signaling, and facilitating cell invasion through cell-independent matrix proteolysis[11]. MVs can also contribute to the pro-invasive character of tumors and increase oncogenic intercellular transformation[12,13]. Differential centrifugation and flow cytometry are the commonly used isolation and detection methods, respectively[10,14].
Exosomes
Exosomes were first discovered by the Stahl and Johnstone groups in 1983[15,16]. Exosomes are small EVs with a size from 30-150 nm and can be produced by a majority of living cells[17,18]. Exosomes are secreted by exocytosis of multivesicular bodies and released into the intercellular environment[19]. As Figure 2 shows, hallmarks of exosomes include the tetraspanins (CD9, CD81, and CD63), ALG-2-interacting protein X (ALIX), and tumor susceptibility gene 101 (TSG101) protein[20]. The tetraspanins can serve as surface markers for exosome immuno-affinity isolation, and ALIX and TSG101 are commonly intravesicle biomarkers of exosomes[21,22]. In addition, exosomes are involved in many cellular functions such as metabolism and receptor transportation[20,23], horizontal transfer of mRNA and miRNA[24], and as a vector for oncogenic transfer[10]. Studies focused on exosomes include isolation and purification[25-28], surface and intra-vesicle protein marker analysis[29-32], cargo mRNA and miRNA analysis[6,33,34], secretion and uptake pathways[35-37], surface and cargo modification[38-41], drug delivery[42-44], and disease diagnosis and management[45-47].
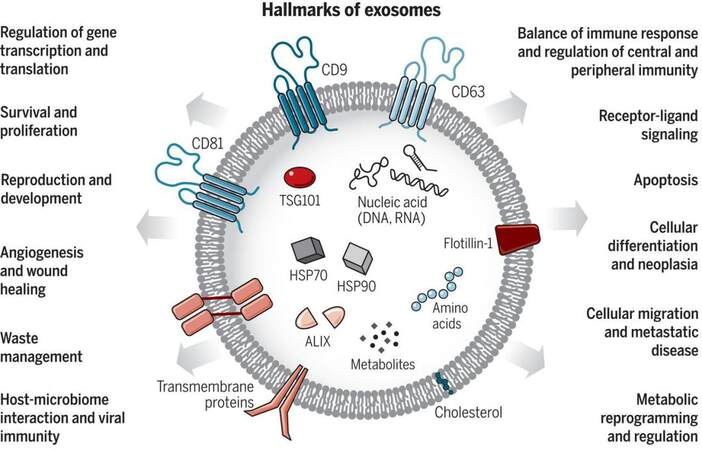
Figure 2. Exosomes are small EVs (sEVs) with the size range from 30 to 150 nm. Exosomes carry various types of molecules originating from the cell-of-origin including proteins, nucleic acids, lipids, and metabolites. Exosomes also play essential roles in cellular communication and regulation (Reproduced from[20]).
Apoptotic bodies
Apoptotic bodies are generated as a result of programmed cell death and are primarily produced by cells undergoing apoptosis. Apoptosis occurs during cell-damaging or aging with the purpose of homeostasis. Cells can also show characteristic morphologies, including cell blebbing and shrinkage, nuclear fragmentation, and condensation/fragmentation of genetic material. Apoptotic bodies that are 500-1,000 nm in size are released as a product of apoptotic cell disassembly[8]. Like other types of EVs, apoptotic bodies contain protein, RNA, DNA, and other cellular fragments[48-51]. However, the only marker to recognize apoptotic bodies is phosphatidylserine (PS)[52].Apoptotic bodies coordinate many cellular membrane molecular patterns, including high-mobility group box 1, heat shock protein 90, and interleukin-33 to facilitate cell blebbing[53]. Also, the caspase-mediated activation of pannexin 1 (PANX1) signal pathway serves as a “find-me” signal for phagocytosis and further apoptotic cell removal[53]. The receptor locating [PANX1[54], CX3C-chemokine ligand 1 (CX3CL1)][55], and uptaking [phosphatidylserine (PtdSer)[56], calreticulin (CRT)[57]] signaling pathway are well studied, but the detailed pathway on how cells are divided into small apoptotic bodies remains unraveled[48,49,53].
EVS AND THEIR MOLECULAR CONTENT
EV cargo mainly consists of various types of proteins and RNAs. Commonly found proteins in EVs are cytoskeletal, cytosolic, plasma membrane, and proteins that show post-translational modifications[58]. In addition, the tetraspanins, such as CD9, CD63, CD81, and CD82, have been found to be present in exosomes[58]. These transmembrane proteins are usually found on the surface of small EVs and can be used as targets for both small EV isolation and detection. However, recent studies have found that the tetraspanins can also be expressed on the surface of large EVs, including MVs and apoptotic bodies[59,60]. EVs can be secreted by most living cells, particularly tumor cells because of the continuous release and transfer of oncogenic information[17,18]. With the feature of containing host cells’ hallmark proteins, tumor-related markers can be expressed on both EV surfaces and within the vesicle[61-63].
The EV membrane also contains different types of receptors or ligands to trigger intracellular signaling pathways via a simple interaction in order to initiate an uptake process to deliver the enclosed information into target cells. The well-studied receptors and ligands pairs for EV uptake include the C-type to P-selectin glycoprotein ligand-1[35,64], Galectins to Glycans[65,66], mucins to galectin-3[66,67], and PANX1 to purinergic receptor[53,55].
RNA is also an important biomarker for disease management because of the function RNAs play in genetic regulation. The RNA content of EVs has been studied using such techniques as next generation RNA sequencing and RT-qPCR[68]. Many different types of RNAs have been found in EVs, including mRNA, non-coding RNA, miRNA, and tRNA[58]. mRNA is a widely studied RNA type found in EVs. Although cellular mRNA has about 400-12,000 molecules, EV mRNA typically has < 700 molecules and can be fragmented sections of mRNA and not full length transcripts[69,70]. Publications have shown that some types of mRNAs are only found inside EVs, but not expressed in the parental cells[24,71,72].
miRNAs are small non-coding RNAs of about 22 nt in length. miRNAs are best known as gene silencing agents of complementary mRNAs and serve to regulate gene expression[73,74]. Because miRNA is associated with gene expression regulation, upregulated mRNAs may not be translated into the expected protein due to miRNA interference[75]. miRNA has been found in body fluids with complementary RNA-binding proteins that prevent enzymatic degradation[76-78]. With the same purpose as carrying mRNA, EVs also serve as vectors to transport miRNA to recipient cells[68]. EV-related miRNAs have been studied for cancer, such as miR-21 and miR-210[79-81], and post-radiotherapy-related miRNAs such as miR-130a-3pand miR-92a-3p[34,82]. Understanding the RNA composition of EVs has become a critical endeavor for disease management.
DIAGNOSTIC POTENTIAL OF EVS
Due to the valuable cargo EVs can carry, they have been widely studied as potential biomarkers for different diseases[83-85]. However, processes such as anticoagulation and endotoxin tube contamination can affect EV concentration in blood, which complicates enumeration data[86-88]. One advantage of EVs as a biomarker over many soluble molecules in the blood like hormones and cytokines is the inherent protection of the EV cargo from degradation, thus keeping the cargo intact and functional. Hence, EVs can be released from any location and into the bloodstream making them easily accessible for liquid biopsies. Additionally, the literature has shown that EV quantity, phenotype, or cargo content can change during disease progression[89-92]. Because tumor cells constantly release EVs, tumor-related EVs in plasma are at higher concentrations compared to normals[89,93]. Therefore, understanding tumor-related EV molecular profiles can help provide a fingerprint for precision medicine.
EVs have also been studied as biomarkers for many non-cancer diseases, including diseases of the central nervous system[94], liver (liver damage in viral hepatitis, hepatocyte injury in alcoholic, drug-induced, and inflammatory liver diseases)[95], kidney (intrinsic kidney disease)[96], brain (stroke)[97], lung (Asthma)[98], arteries (atherosclerosis)[99] and radiation injury[34].
CONVENTIONAL METHODS OF EV ISOLATION
In order to analyze EVs’ cargo, EVs of interest must be isolated in high purity and high yields from body fluids because non-diseased cells also generate EVs that can mask subtle molecular signatures of disease. With increasing studies conducted on EVs, many techniques have been developed to isolate EVs from liquid biopsies. Some of these isolation techniques select the entire EV sub-types irrespective of the cells of origin and others can be specific so as to isolate only the disease-related EVs. In the next few sections, different conventional isolation strategies will be discussed.
Precipitation and spin columns
Hydrophilic polymers, such as polyethylene glycol (PEG), reduce solubility by lowering the hydration of EVs and lead to precipitation[100] [Figure 3A]. These kits can be used to separate EVs using lower spin speeds with higher yields compared to ultracentrifugation (UC). Upon addition of precipitation reagents, the solubility of proteins is also decreased[101], and thus the isolate can contain protein impurities that can have a detrimental effect on downstream processing. Some of the advantages of precipitation reagents include preservation of EV integrity, no need for extensive equipment, selection pH close to the physiological range, and the possibility to process a large number of samples simultaneously[102]. However, poor reproducibility, impurities, and retention of polymer are a few drawbacks[103-105].
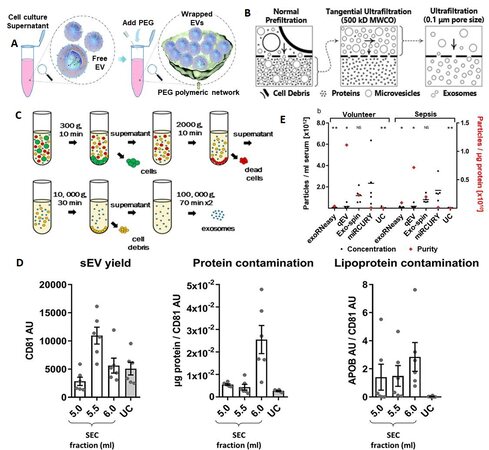
Figure 3. Conventional methods for EV enrichment. (A) Polymer-based enrichment: Precipitation with polyethylene glycol (PEG) (reproduced from Reference 100). (B) Filtration and ultrafiltration for EV isolation: normal prefiltration can collect sEVs and particles into the bottom layer of the culture dish. The bottom layer needs to be processed through tangential ultrafiltration, and the retentate is collected. Further ultrafiltration with expected pore size can be further processed and the EVs with a size smaller than the pore size will be present in the permeate (reproduced from[28]). (C) Ultracentrifugation for EV isolation (Reproduced from[111]). (D) Summary of yield and purity of sEVs isolated by SEC or UC: Normalization of APOB signal to CD81 content as an estimate of sEV purity from lipoproteins, also demonstrated almost 60 times higher APOB/CD81 ratio in the peak sEV fraction of SEC (5.5 ml) compared to the UC samples. SEC resulted in a higher yield of sEVs but with marked contamination by soluble protein and lipoproteins (reproduced from[116]). (E) Analysis of EVs by NTA demonstrates differences in size distribution. Black bars indicate the absolute number of vesicles isolated from 1 ml of serum; red diamonds plotted against the right x-axis represent vesicle purity defined as the particle to protein ratio. While precipitation most efficiently isolated EVs from serum, SEC-based isolation yielded fewer but more pure vesicles. Asterisks indicate significant differences in particle numbers compared to miRCURY. *P < 0.05; **P < 0.01; NS: not significant. All data are mean ±SD for five volunteers and five sepsis patients (reproduced from[117]). NTA: Nanoparticle tracking analysis.
Filtration
Filtration has been used as an isolation method for small particles based on size using nanomembranes[28,106]. Many times a sequential filtration or combined filtration with ultracentrifugation is used to provide high-grade exosomes [Figure 3B]. A modified polyethersulfone membrane is used for the pre-filtration of cell culture media, which can pass through the membrane. Then, tangential flow filtration with a 500 kD molecular weight cut off hollow fiber filter is used to filter out proteins. A final step with a low-pressure filtration can only make the desired size (smaller than pore size) of particles present in the retentate. Sequential filtration can generate a throughput of 0.96 mL/h, and the size distribution of isolated EVs can be controlled. However, clogging and shear stress can be applied to the particle, damaging the EV particle[107,108].
Ultracentrifugation
Ultracentrifugation is based on separation of particles according to their buoyant density. To affect the enrichment of EVs, several UC steps are typically undertaken. First, the particles with high buoyant density like cells (300-400g), cell debris (2000g), aggregates of biopolymers, apoptotic bodies, and other structures with a density higher than EVs are sedimented [Figure 3C]. The resulting supernatant with EVs is ultracentrifuged at > 100,000g for 2 h, which yields an EV pellet[109-111].
In density gradient UC, a continuous density gradient including a sucrose or iodixanol density gradient and differential centrifugation is used[111]. In some cases, enriched EVs are further purified using filtration (0.1, 0.22 or 0.45 µm) or subsequent washing steps, which increases the purity of EVs but decreases the yield[112,113]. While UC can isolate EVs from large volumes of sample, some drawbacks include long isolation times (140-600 min), non-exosomal impurities, low reproducibility, and efficiency affected by the type of rotor, force, and sample type and only six samples can be processed in a cone ultracentrifuge[109,113,114]. Although UC methods yield low EV quantity compared to many other EV enrichment methods, Alvarez et al.[115] has reported that UC with a sucrose density gradient yielded high purity. EVs of the size range 20-250 nm can be isolated by UC with the isolated EVs appropriate for assaying RNA and miRNA[112]. UC and size-exclusion chromatography (SEC) have been systematically compared for isolating small EVs (sEVs; exosomes) in rat plasma and results [Figure 3D] revealed that SEC-sEVs had higher particle number, protein content, particle/protein ratios and sEV marker signals than UC-sEVs. However, SEC-sEVs also contained greater amounts of APOB+ lipoproteins and large quantities of non-sEV protein[116].
Comparison of different EV isolation techniques
Comparison of different EV isolation kits revealed that the total number of particles isolated from serum was the highest for miRCURY (precipitation), followed by Exo-spin (Size-exclusion chromatography), qEV (Size-exclusion chromatography), UC, and exoRNeasy [Figure 3E]. Also, SEC-based isolation yielded EVs with significantly higher particle-to-protein ratios than all other methods, indicating less co-isolation of soluble proteins. Isolates derived from precipitation and UC, on the other hand, displayed the lowest ratios due to increased protein contamination[117]. Side-by-side analysis of four kits also showed differences in performance. The size distribution of the isolated particles was appropriate (40-150 nm), and ExoQuick™ Exosome Precipitation Solution (EXQ) generated a relatively high yield of exosomes. However, albumin impurity was abundant for all the evaluated kits. There was significant correlation of the exosomal miRNA profile and specific miRNAs between kits, but with differences depending on methods. ExoRNeasy Serum/Plasma Midi Kit and EXQ performed better in the specific exosomal miRNAs recovery[118].
Affinity selection
EVs can contain protein makers that represent the cells from which the EVs originated. Tumor-derived EVs can express essential tumor-related proteins used for cancer disease diagnosis or progress monitoring[58,119]. By targeting specific proteins on the surface of EVs using immunoaffinity-based approaches, a specific type of EV can be collected. A variety of proteins can be targeted as biomarkers for EV isolation including the tetraspanins such as CD9, CD81, CD63, and cancer-related markers such as EpCAM, CD24, and CA125. Antibodies can be immobilized on a substrate such as the surface of a microplate or beads, and bind the EVs onto their surfaces only if they express an antigen specific to the capture antibody. Using immunoaffinity, the isolation can result in high specificity and purity for a particular EV subtype[120,121]. However, due to the cost of affinity-based assays, the isolation can only be applied with a small volume of sample, and EV-related proteins or RNA yields can be limited[120,122].
The primary advantage of affinity isolation of EVs is that if the correct targeting surface antigen is used, the isolated EVs can be associated predominately to those that are disease-associated that can be advantageous for downstream molecular analysis. However, if the affinity isolation uses the tetraspanins, all EVs, in particular the exosomes and MVs, will be in the isolate.
MICROFLUIDICS FOR EV ENRICHMENT
Many of the recently reported platforms for the isolation of EVs have been based on the use of microfluidics for several reasons including their ability to be integrated to post-enrichment processing steps such as enumeration and/or molecular profiling of the EV cargo. The enriched EVs can be enumerated[123-128], surface and cargo proteins analyzed[29,123,124,129-131], RNA profiled[33,125,128], or diagnostics performed[132-134]. By including the appropriate micro-or nanoscale structures within the chip, approaches including affinity selection, filtration, centrifugation, viscoelasticity, and acoustic waves can be used for EV isolation using a microfluidic.
Affinity enrichment
Affinity enrichment can enrich primarily disease-associated EVs, improving the quality of the molecular data secured from the isolate[135]. The ExoChip is an early example of a microfluidic used for affinity enriching EVs[124]. The ExoChip was fabricated using soft lithography and polydimethylsiloxane (PDMS) with surface-attached antibodies targeting CD63. Clinical serum samples were analyzed with immune-electron-microscopy and Western blotting used to confirm isolation of the EVs.
Many microfluidic devices used EV-specific markers, such as the tetraspanins because in some cases disease-specific can be downregulated during disease progression. A newer version of the ExoChip (newExoChip) used phosphatidylserine for enrichment[131] [Figure 4A]. PS is expressed in the lipid bilayer of cancer-related EVs. The newExoChip achieved 90% capture efficiency of cancer-related EVs with the affinity-captured EVs released by Ca2+ chelation.
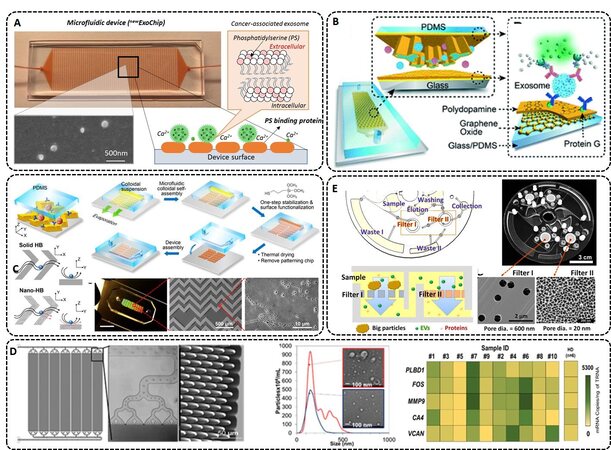
Figure 4. (A) newExoChip design, which features 30 × 60 circular patterns with a diameter of 500 μm in standard glass microscope slides. The mechanism of capture and release of cancer-associated exosomes using Ca2+-dependent binding between PS and annexin V and ethylenediaminetetraacetic acid (EDTA)-based Ca2+ chelation. The micrograph shows capture and released exosomes (reproduced from[131]). (B) Nano-interfaced microfluidic exosome platform (nano-IMEX). Schematic of a single-channel PDMS/glass device with expanded-view highlighting the coated PDMS chip containing an array of Y-shaped microposts. The surface of the channel and microposts coated with graphene oxide (GO) and polydopamine (PDA) as a nanostructured interface for the sandwich ELISA with fluorescence signal amplification (reproduced from[123]). (C) 3D herringbone nanopatterns are designed on a microfluidic device with the ability to detect tumor-associated EVs in plasma with a minimum of 200 vesicles per 20 µL. The nano-structures were used to increase the surface area, content mass transfer, and EV capturing speed, and reduce the hydrodynamic resistance (reproduced from[129]). (D) Microfluidic device made from cyclic olefin polymer (COP), which allows for high-rate production at a low cost to accommodate diagnostic applications. CAD drawing of a 7-bed EV Microfluidic Affinity Purification (EV-MAP) showing the distribution channels and the diamond-shaped micropillars of the device. NTA and TEM images of EVs isolated from a clinical sample by PEG precipitation and affinity selected with anti-CD8 mAb using the EV-MAP device. Heat map analysis of clinical samples (marked with numbers) and healthy donor for 5 genes whose up-regulation is associated with acute ischemic stroke (reproduced from[139]). (E) ExoDisc integrated system that combines a sequential filtration and centrifugation steps used for low viscosity fluids. The EVs are collected between filter I and filter II. The filters can be replaced with different pore sizes for different expected size range selection (reproduced from[33]).
A graphene oxide/polydopamine (GO/PDA) nano-interface was used to increase the EV capturing surface area[123] [Figure 4B]. The capture antibody targeting CD81 and detection antibodies targeting CD81, CD63, and EpCAM were used to characterize the EVs and remove interferences from the sample. The assay provided a detection limit of 106 particles/mL. Compared to the direct surface modification of GO or PDA only, the GO/PDA nano-matrix increased antibody capture efficiency of EVs by ~2-fold.
An approach was reported using multiscale integration by designed self-assembly (MINDS) 3D nanostructures as the capture surface for EVs[129] [Figure 4C]. With MINDS, flow streams can pass through a bumper structure and a nanostructured herringbone (nano-HB) results in enhanced contact time of the EVs with the capture surface. This offered a limit-of-detection of 10 EVs/µL and a total minimum detectable particle number of 200 per assay. For verification of the platform, 20 ovarian cancer patients and 10 non-cancer control plasma samples were processed, and differences were achieved between the two groups in terms of the number of enriched EVs.
It is difficult to mass-produce PDMS-based microfluidic devices[136]. As an alternative, thermoplastics are attractive because of their ability to be mass-produced and the simple modification protocols that can be employed to change their surface chemistry[31,137,138]. A cyclic olefin copolymer EVHB-chip was manufactured with micro-injection molding and was designed to isolate tumor-specific EV-RNAs[125]. The herringbone structure was compared to a flat channel surface and the results indicated that the herringbone device captured ~60% more EVs. The device could process a wide range of sample volumes (100 µL to 5 mL) with a limit-of-detection of 100 EVs/µL.
Another group developed a microfluidic device using thermoplastics made via micro-injection molding[139]. A 7-bed EV Microfluidic Affinity Purification (EV-MAP) device contained diamond-shape pillars [Figure 4D] with a 10 µm diameter and 10 µm spacing to allow for high throughput processing for enriching EVs via affinity selection (1.5 million pillars per chip). The device was used for diagnosing acute ischemic stroke patients using exosomal mRNA. mRNA expression of CD8+ EVs indicated that for genes upregulated during an ischemic stroke event, the EV-MAP device was successful in enriching EVs from clinical plasma samples, and gene profiling the EVs via droplet digital PCR for identifying stroke patients with a total processing assay time of 220 min. When the EVs were isolated using PEG precipitation, which isolates the entire EV subtypes, mRNA expression differences for stroke patients were not observed.
Centrifugation and filtration enrichment
Filtration can be used as an EV microfluidic isolation method. An Exodisc was reported using a combination of centrifugal forces and nano-filtration[33] [Figure 4E]. With a centrifugal force limit of 500g, EV sizes of 20-600 nm could be collected between two nano-filters. Filter I (600 nm pore size) was used to remove large particles, and Filter II (20 nm pore size) was used to enrich the EVs and exclude free proteins. The entire EV population was collected in 30 min with a recovery of 95%. Another platform with a combination of centrifugal force and filters was reported for inline EV detection by flow cytometry[126]. The EVs were isolated by anti-CD81 antibodies and with affinity microbead incubation, the enriched EVs could be concentrated and stained with a fluorescent dye.
Contactless EV enrichment methods
Researchers have also focused on contactless methods for EV enrichment using microfluidics, which takes advantage of the fluid associated with a microchannel and/or microstructures in the channel to affect the EV enrichment process. A microfluidic viscoelastic flow was developed for size-dependent isolation of EVs[127]. Poly(oxyethylene), PEO, was added into a sheath fluid at a concentration of 0.1% to maintain the feed solution at a particular viscosity. The particles were driven by an elastic force that situated particles in certain flow lines based on the size of the particle with larger particles traveling towards the center of the channel. The authors were able to demonstrate sEV recovery of ~80%.
Microfluidic viscoelastic flow was also developed using an acousto-fluidic device for EV isolation[128]. The platform included two unique surface acoustic wave modules that were operated at 19.6 MHz for cell isolation and 39.4 MHz for EV isolation. The acoustic isolation was based on size because of the deflection caused by the acoustic pressure. The cell removal rate was > 99.999%, which resulted in 75% to 90% reduction of red blood cells. Using the modules in series, the isolation of 110 nm particles from whole blood yielded > 99% recovery, and the purity of the sEVs was ~98.4%.
METHODS FOR EV DETECTION
Following isolation/enrichment of EVs, the EVs must be enumerated and their molecular content analyzed in many cases. For molecular cargo determinations, methods that can be used for protein or nucleic acid determinations include Western blotting, ELISA, RT-qPCR, and next generation sequencing. These methods rely on the disassembly of the EVs so as to analyze their intra-vesicular content. In spite of the high numbers of EVs found in clinical samples there are challenges when attempting to analyze their molecular content. For example, in spite of the exponential amplification of cDNA following reverse transcription, a certain mass of mRNA or miRNA must be secured to see a detectable signal. This is further complicated by the fact that most EVs do not contain full-length transcripts, and as such, the polyadenylated tail used for priming for the reverse transcription step may not be present and the yield of cDNA would be low. However, using random hexamer primers for reverse transcription as opposed to poly dT primers that bind to the polyadenylated tail of full length mRNA transcripts can address partially this challenge[140,141].
Because the molecular assay requires lysis of the EV to release the intra-vesicular content, the population and morphological properties of the EVs must be determined in advance of the molecular analyses. Therefore, it is necessary to conduct assays to assess population and morphological properties of the enriched EV fractions prior to the molecular assay.
A challenge with intact EV analysis includes the diverse size range of the vesicles (30-1000 nm), their low mass loads (for a 150 nm diameter vesicle, may contain ~10,000 nucleotides of various nucleic acids, and 10-100 protein molecules), and their relatively high particle numbers. As opposed to biological cells, which are 1-100 µm in diameter, special types of techniques must be used to characterize and count the intact vesicles due to their small size. For example, while conventional flow cytometry can be used for biological cells, variants of flow cytometry must be considered for enumerating EVs. In addition, while conventional Coulter counters can be used to enumerate biological cells, nano-Coulter counters must be used to enumerate EVs.
Current methods that can directly analyze EVs from a physical perspective include: (1) size and concentration analysis Nanoparticle tracking analysis (NTA), resistive pulse sensing (RPS), which can provide information on the size distribution of EVs and estimate concentrations; (2) surface protein expression analysis of EVs, which can determine the type and amount of protein expression by labeling with specific antibodies and fluorescent reporters that can permit the use of nano-flow cytometry; and (3) electron imaging of EVs. Direct imaging techniques include Transmission electron microscopy (TEM), Scanning electron microscopy (SEM), and atomic force microscopy (AFM), which can visualize the overall structure of the EVs including their size. In the sections that follow, a discussion on NTA, electron microscopies, nano-flow cytometry, and RPS will be provided for performing concentration and morphological analysis of EVs [Table 1].
Comparison of EV detection techniques
| EV Detection Technique | Principle | Potential Advantage | Potential Disadvantage |
| Nanoparticle Tracking Analysis (NTA) | Dynamic light scattering and Brownian motion | Straight forward operation; Both size variation and concentration information can be collected; Available addon parts for fully automatic operation | Sensitive to vibration; Contamination particles can also be included; High cost for the instrument and addon parts |
| Electron microscopies. | Electrons as the source of illumination | High-resolution images; Direct illumination for EV morphology | High cost for the instrument; Not appropriate for quantitative analysis; EV morphology may be damaged by the sample preparing steps |
| Atomic force microscopies | Scanning cantilever over the surface | High-resolution images; Ture 3D image with surface topology determinations | High cost for the instrument; EV morphology may be damaged by the scanning cantilever |
| High-Resolution Flow Cytometry | Light scattering or fluorescent excitation | Sub-type EV labeling and detection; Principle is applicable in micro/nano-fluidic technology for better sensitivity | Sensitivity limitation for particles size < 200 nm |
| Resistive pulse sensing (RPS) | Nanopore blockage with changes of current or potential | Higher sampling frequency comparing to optical sensing; Principle is applicable in micro/nano-fluidic technology for better sensitivity | Fabrication with intricate nano-structures, Small sampling efficiency; Calibration is required for each nanopore design |
Nanoparticle tracking analysis
NTA is a commonly used method for size and concentration determinations of EV samples[142-144]. Both dynamic light scattering and Brownian motion are the essential processes used to determine the size and concentration of particles using NTA. Figure 5 shows the measurement principles of NTA[145]. A laser beam illuminates the sample cell and the scattered laser beam travels through the objective of the microscope, which is analyzed by a CCD camera. The Brownian motion of each particle can be recorded and analyzed by the Stokes-Einstein equation [Figure 5], where D is the diffusion coefficient and calculated by the mean-square of particle movement, KB is the Boltzmann’s constant, T is temperature, η is the solution viscosity, and dh is the particle diameter. From this equation, the particle’s dh can be calculated if the solution viscosity and temperature are known. In addition, by analyzing the particle presenting scattered radiation event frequency in each of the CCD image frames, concentration information can also be secured.
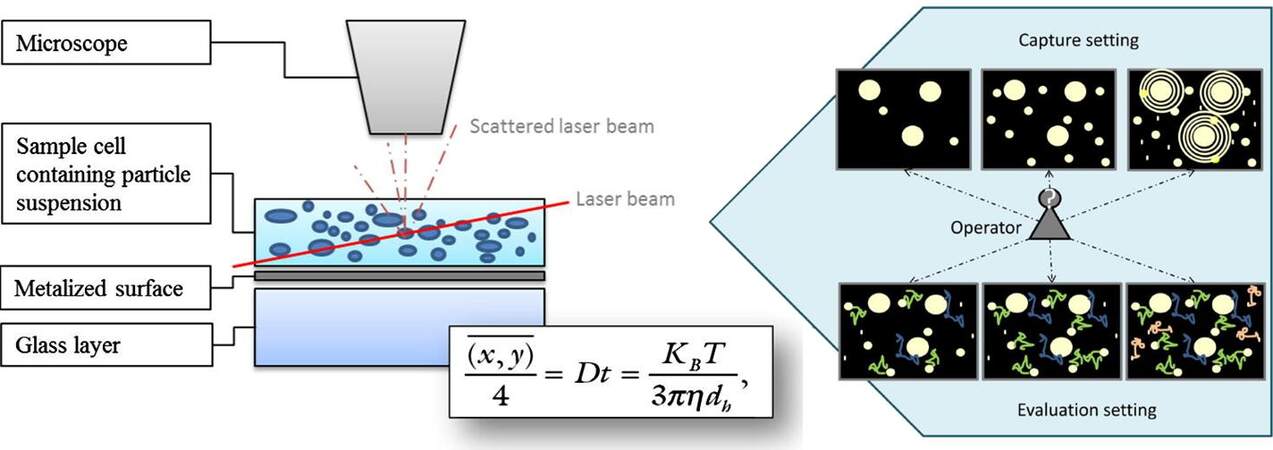
Figure 5. The principle of NTA measurements and the Stokes-Einstein equation for the analysis of particle size (reproduced from[145]).
Considering the calculation is based on particle diffusion, NTA is typically useful for analyzing small particles with a size between 10 and 1,000 nm in diameter. NTA performance for monodispersed and polydispersed homogeneous particles has been confirmed in previously published work, while the performance for non-homogeneous particles, such as EVs or biological vesicles, is still under development[146].
In past studies, researchers have found that the introduction to a variety of parameters can increase the variability of results by up to 50%, including the threshold setting of the camera, the source of the EV sample, small vibrations, and even the method of operation[143,144,147]. Some state that sample dilution, camera grade, version of the analysis software, and the sample's size distribution should also be considered for an accurate EV size and concentration determination[143,145,146]. A study encompassing the detection and analysis of EV samples, microvesicle samples, artificial vesicle samples, polystyrene latex beads, and silica microspheres with NTA has been undertaken[143] [Figure 6]. For artificial vesicles and polystyrene beads, the size variation and concentration were 3% and 9%, respectively. However, differences in the size of the EVs ranged from 1% to 6% and concentration varied from 5% to 18%. NTA also has some other drawbacks, such as a large sample size requirement (> 250 µL), an limited dynamic range (106-109 particles/mL), and only low viscosity samples can be analyzed, and need vibration free environment for analysis.
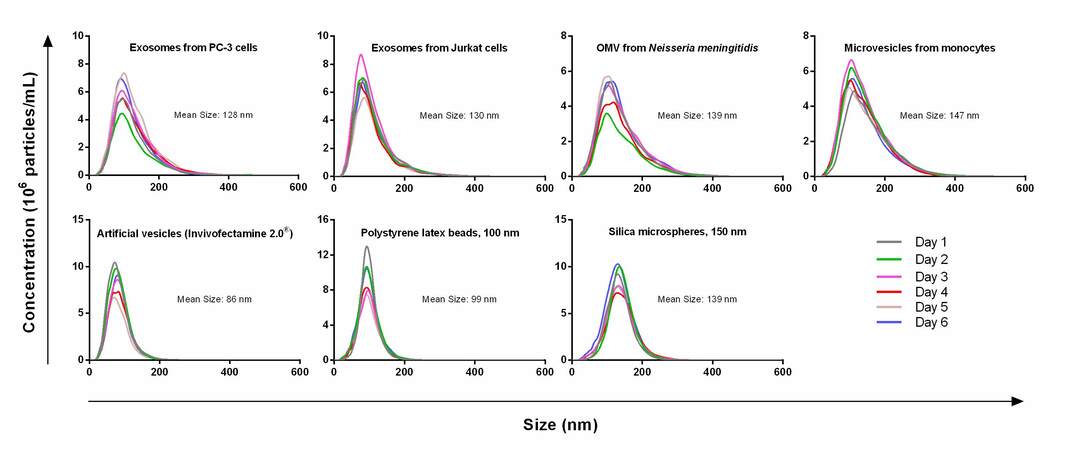
Figure 6. Concentration variations for different types of samples including EVs from PC-3 cell culture media, EVs from Jurkat cell culture media, Outer membrane vesicle from Neisseria meningitidis, microvesicles from monocytes, article vesicles, polystyrene latex beads (100 nm), and silica microspheres (150 nm). The samples were tested on 6 different days and the variation is from 1% to 18% (Reproduced from[143]).
Electron and Atomic force microscopies
Electron microscopy can be used to image nanoscale samples, including EVs. In some cases, a perception bias may be introduced with imaging location selection, and it is also challenging to get an overall population estimation when the imaging areas are manually selected. However, electron microscopy, which includes TEM and SEM, is still a primary option when the morphology of EVs needs to be determined. Both electron microscopies use a beam of electrons, while TEM produces images using electrons transmitted through the sample and SEM analyzes the scattered electrons. TEM is most often used to collect information from the internal structure of the EV, while SEM can be used to interrogate surface structure. The resolution of both TEM and SEM can be as small as 1 nm[148]. However, the high-resolution advantage of TEM can be circumvented by sample preparation needs for EVs, which requires fixation and dehydration before imaging. Unlike cells with a cytoskeleton, EVs do not have an internal supporting structure. When the EV sample is dehydrated, the vesicle can form a cup-shape with loss of original morphology[47,129,149,150] [Figure 7A and C]. Several studies have shown that EVs have a sphere-shaped morphology[151] [Figure 7B]. Other papers have reported that EVs in SEM still show a cup-shaped morphology because the EV samples also undergo the same fixation and dehydration process [Figure 7C]. To overcome sample deformation, cryo-TEM can be used. For cryo -TEM, the sample can be placed in vitreous ice at the temperature of liquid nitrogen to eliminate the fixation and dehydration steps[152,153].
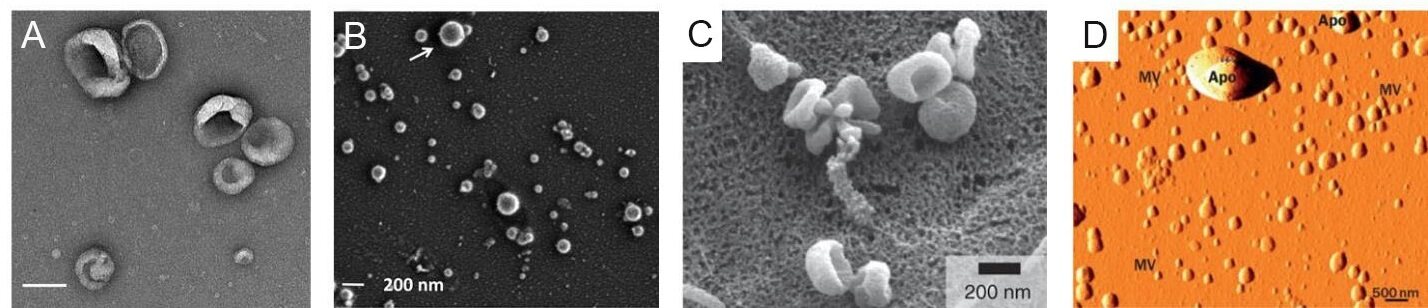
Figure 7. (A) Transmission electron microscopy image of EVs (scale bar = 100 nm). (B) Scanning electron microscope image of EVs showing the circular shape of the EVs (reproduced from[151]). (C) Scanning electron microscope image of EVs, which shows cup-shaped EVs (reproduced from[150]). (D) Atomic force microscope image for EVs (reproduced from[156]).
AFM can record surface structure using a probe and laser reflection. A cantilever (i.e., probe) can deform while it interacts with the surface of the sample and the deformation of the probe caused by surface morphological changes can be sensed by laser reflection using position-sensitive photodiodes. AFM can obtain a true 3D image of surface structure and is commonly used for surface topology determinations[154] [Figure 7D]. However, because EVs do not have an internal supporting structure, the vesicles tend to deform during sample preparation and imaging. For EV sample probe scans with monoclonal antibody immobilization are usually combined for better imaging quality[155,156].
High-resolution flow cytometry
Flow cytometry (FC) is frequently used for cell analysis providing the quantitative information of markers on the surface and internally to the cell. Conventional FC is typically used to analyze particles with a size > 300 nm. As Figure 8A shows, FC uses a laser beam with a specific wavelength, which impinges on a sample stream consisting of single particles arranged in a single file line generated by a sheath flow. The particles in the stream can scatter light from which critical information can be secured. For example, the scattered light can be used to determine particle size. Another functional mode of FC is fluorescence readout, which is typically produced by labeling certain cellular organelles or molecules with fluorescent labels. Because the specific biomarker is dye-labeled, FC can collect information that includes the expression level of the marker of interest. For example, FC can be used to analyze the cytotoxic T-lymphocyte related immune response by labeling CD8 expressing cells.
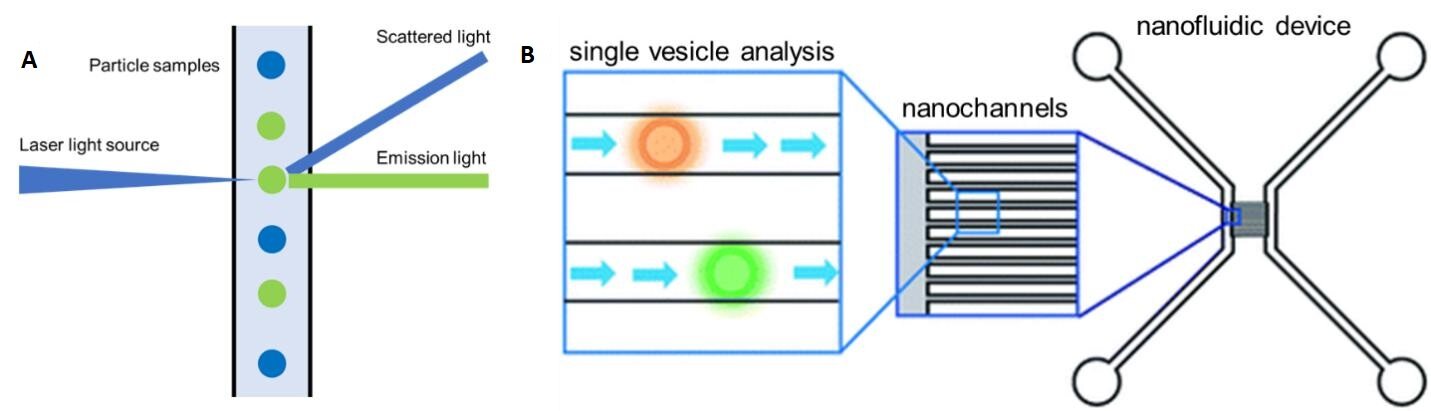
In recent years, FC has also been applied for quantitative analysis of EVs. However, FC has a sensitivity limitation when it is applied to particles with a size smaller than 200 nm[157-159]. To overcome this drawback, the EV membrane is usually over labeled with a lipophilic dye, such as PKH26 or PKH74 to increase signal intensity[160,161]. The EV can also be analyzed indirectly when an adapter is applied[162,163]. The adapter typically carries a large quantity of fluorescent molecules to enable detection. Instead of directly sensing the EV, a well-calibrated adapter can provide higher intensity readouts by FC.
Friedrich et al.[164] developed a nanofluidic device to analyze EVs using FC [Figure 8B]. In this case, the sensing component consisted of a fluorescence microscope and an array of nanofluidic channels used as the flow cell. The device contained ~100 nanochannels with a size of 300 nm (width) × 300 nm (depth). Each nanochannel served as an individual FC sheath flow sampling unit and only 20 μL of sample was necessary for a typical measurement. The dynamic range of the nanofluidic device was from 1010 particles/mL to 1014 particles/mL. However, with this FC format, only concentration information of the EV sample was provided, but needed highly specific pre-isolation before sample readout[159,165].
Resistive pulse sensing
RPS was first developed in 1976 for viral particle detection and characterization[166,167]. In 1996, Kasianowicz et al.[168] utilized the biological nanopore as a Coulter counter for single-stranded DNA, and soon the RPS principle was applied to DNA sequencing due to different signal shapes of the four canonical DNA bases[169,170]. In recent years, RPS with flexible pore sizes and shapes has been used for EV concentration determinations and size analysis[147,171] [Figure 9].
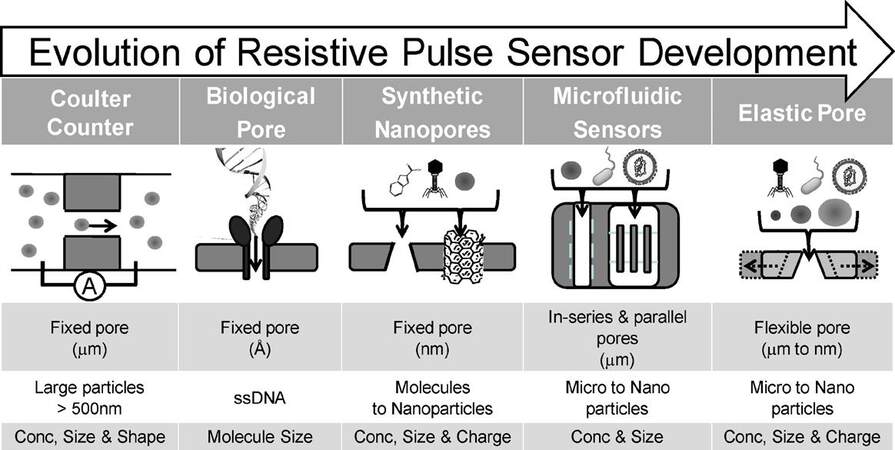
Figure 9. The evolution of resistive pulse sensing (RPS) from fixed pore with micro-scale to flexible pore with micro- to nano-scale sizes. RPS can also be applicable as a Coulter counter for EV analysis with the proper sized pore (reproduced from[171]).
Equation 1.

The RPS principles generate an output that can either be a change in potential or current measured across the nanopore structure. Whenever a particle moves through the nanopore, a proportion of the carrier electrolyte is replaced, which creates a change in the resistivity across the pore[172] [Figure 10A]. The change in voltage across the pore can be described using Equation 1, where ΔE is the voltage change between the occupied and unoccupied pore, E is the applied potential, ρs is the pore surface resistivity, α is the pore resistance to load resistance, L is the effective length of the nanopore, d is the particle diameter, D is the pore diameter, and ρ is the fluid resistivity[166,167]. For most cases, the majority of the parameters remain constant when a rigid pore and a homogeneous electrolyte are used for the RPS measurement. Thus, the size (d) of the particles in the sample can be determined by analyzing the amplitude of the electrical event (ΔE). In addition, with a known flow rate and event number, the concentration of the particles in the sample can be obtained as well. Equation 1 is primarily applicable to non-conductive particles because additional parameters must be considered for conductive particles including surface charge, particle charge density, and the permeability coefficient[167,173]. Also, for permeable biological vesicles, the particle resistivity may be lower than the carrier electrolyte due to the internal composition of the particle. As a result, some particles can produce the opposite polarity of signal compared to non-conductive particles[173-175].
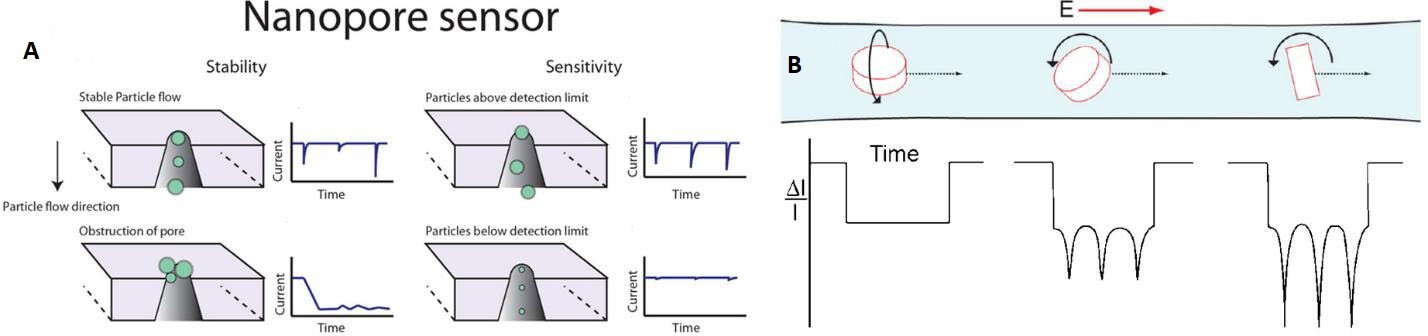
Figure 10. (A) The principle of RPS measurements with constant potential or current clamping across the measuring pore. The amplitude profile shows a relationship with particle size. The particle size distribution information can be determined by analyzing the event amplitude, and the event frequency can be analyzed for concentration information (reproduced from[172]). (B) The RPS is also used to study the particle shape, movement, and interaction with the solvent. The event can express the particle shape and also the rotation level and axis (Reproduced from[183]).
Synthetic RPS sensors can be fabricated in a controllable fashion, which generates the possibility of unique measurement opportunities compared to naturally occurring (i.e., biological) nanopores, such as altering the nanopore shape or placing nanopores in-series or in-parallel. The nanopore in-series can provide additional information about particle movement and generate the zeta potential of the particle. When the nanopores are placed in-series for monodispersed samples, the system can provide precise flow rate feedback, which can help to control the stream flow in real time[176]. When the nanopore in-series is used for polydisperse samples with a known flow rate, particles with different charge densities can provide different event duration. Nanopores in-parallel are another design strategy that can be used to increase sampling efficiency and throughput. When the nanopores are set up in parallel with individual electrodes, each nanopore will provide information simultaneously from the output circuit[177-179]. It is also feasible to couple the RPS with an EV isolation microfluidic chip that can be used to analyze the EV sample on-chip negating the need for off-loading the enriched EVs for analysis by NTA. With real-time electrical signal readout, RPS can provide EV sample information during the isolation/elution phases of the assay[172,175].
Compared to optical sensing methods for EV quantification, such as NTA or flow cytometry, RPS can overcome some of their inherent drawbacks. For example, RPS can provide a faster sampling rate, up to 1000× higher[143,172,180]. For optical sensing, the exposure time has to be optimized to the millisecond or second timescale, which can make the sampling frequency ~1000 per second. The electrical signal recording for RPS can typically be set to 500 kHz[181]. In addition, the broad range of sampling frequencies for RPS can increase the dynamic range of the assay, from 105 to 1014 particles/mL[173,181,182]. RPS is also used to collect information about particle shape and movement profile. Figure 10B shows a particle shape and movement signal trace demonstration that includes a disc-shaped particle translocation with different levels and axis of rotation[173,183].
RPS does have limitations for the detection of nanoscale particles. Firstly, because of the nanostructure the sampling efficiency and detection speed can be small with the majority of RPS platforms processing samples in the nanoliter to picolitre volume scale[173,184]. The nanopore in-parallel does make it possible to overcome this limitation, which can linearly increase the processed sample volume based on the number of pores in parallel[173,185]. On the other hand, increasing the through-pore transport speed or decreasing the sampling frequency and bandwidth can decrease the measurement sensitivity.
CONCLUSIONS
As liquid biopsies are growing tremendously for applications in a variety of disease management scenarios, EVs are becoming an important target due to their biological and physical properties, including their relatively high abundance and the molecular information they carry[186-189]. EVs are rich in proteins and RNAs associated with their cell of origin, and these molecular markers have been shown to be useful for screening patients as well as being used to track disease progression[30,190,191]. As particles secreted by cells, EVs can easily pass through a series of biological barriers and travel throughout the circulatory system to their intended location[18,134,192,193]. This property allows EVs to be used as vehicles for drug delivery as well. EVs have also been studied as biomarkers for many non-cancer diseases, including the central nervous system[94], liver (liver damage in-viral hepatitis, hepatocyte injury in alcoholic, drug-induced, and inflammatory liver diseases)[95], kidney (intrinsic kidney disease)[96], brain (stroke)[97], lung (asthma)[98], arteries (atherosclerosis)[99], and radiation injury[34]. In any case, EV isolation/enrichment and quantification have become an important topic for both disease diagnostics and therapeutics. This arises from the fact that EVs are not just released from diseased cells, but non-diseased cells.
The challenge is that EVs must be enriched from a clinical sample prior to analysis of their molecular content and current methods for EV isolation are sometimes inefficient because they require a large volume of sample (UC) or alter the overall structure of the EV[120,194-196]. In addition, most traditional methods of EV isolation enrich the entire EV population consisting of both diseased and non-diseased EVs that can complicate the molecular analysis phase of the assay. Thus, the type of enrichment must be judicially chosen to match the application need. For example, if gene expression of the mRNA cargo from EVs is used for the application, endogenous expression of specific gene transcripts that may be found in non-diseased EVs must be taken into consideration because this may mask the gene expression from the mRNA found in diseased EVs only. Therefore, selection of EVs from the clinical sample using a highly specific disease-associated affinity agent may be required instead of using a non-specific enrichment protocol, such as UC. In addition, the clinical sample type and variation in sample collection and preservation may affect the quality of EVs selected and/or their yield during enrichment. As such, the EV field may need more detailed and clarified standardization protocols to minimize the variation between results emanating from different research laboratories[197].
In many protein or nucleic acid assays using EVs for diagnostics (e.g., ELISA, PCR), high purity of the input sample is required to secure the necessary clinical information[198-200]. By applying micro/nanofluidic technology, high throughput and precise enrichment using affinity capture can secure a higher purity of disease associated EVs compared to many conventional or benchtop methods that isolate the entire EV population irrespective of cell-of-origin. However, these technology platforms are only capable of processing microliter sized sample inputs indicating that sampling statistics may be a concern or securing sufficient molecular cargo to feed into conventional molecular processing pipelines, such as NGS or even droplet digital PCR. Some microfluidic platforms that use label-free or contactless technologies can compensate for this shortfall of total process volume but at the expense of sample purity[127,128,201].
In most cases, whatever molecular processing strategy is used, the intact EVs must be characterized including concentration, size distribution, and morphology, which are primarily based on electron microscopy, AFM, FC or NTA[27,143]. Recently, RPS has also been used for EV size and concentration determinations[157,202]. RPS, because it can be integrated into a microfluidic chip, can allow for straightforward analysis of particle physical characteristics and enumeration data following enrichment into a single device for potential point-of-care testing applications that use EV-based liquid biopsies.
DECLARATIONS
Authors’ contributionsWrote and reviewed the manuscript: Zhao Z, Wijerathne H, Godwin AK, Soper SA
Availability of data and materialsNot applicable.
Financial support and sponsorshipThe authors thank the NIH for financial support of this work (NIBIB P41-EB020594 and P20-GM130423) as well as Tina’s Wish Foundation.
Conflicts of interestAll authors declared that there are no conflicts of interest.
Ethical approval and consent to participateNot applicable.
Consent for publicationNot applicable.
Copyright© The Author(s) 2021.
REFERENCES
1. Macías M, Alegre E, Díaz-Lagares A, et al. Liquid biopsy: from basic research to clinical practice. Adv Clin Chem 2018;83:73-119.
2. Jeffrey SS, Toner M. Liquid biopsy: a perspective for probing blood for cancer. Lab Chip 2019;19:548-9.
3. Tkach M, Théry C. Communication by extracellular vesicles: where we are and where we need to go. Cell 2016;164:1226-32.
4. Zaborowski MP, Balaj L, Breakefield XO, Lai CP. Extracellular vesicles: composition, biological relevance, and methods of study. Bioscience 2015;65:783-97.
5. Raposo G, Stoorvogel W. Extracellular vesicles: exosomes, microvesicles, and friends. J Cell Biol 2013;200:373-83.
6. Wei Z, Batagov AO, Schinelli S, et al. Coding and noncoding landscape of extracellular RNA released by human glioma stem cells. Nat Commun 2017;8:1145.
7. He M, Zeng Y. Microfluidic Exosome Analysis toward Liquid Biopsy for Cancer. J Lab Autom 2016;21:599-608.
8. Revenfeld AL, Bæk R, Nielsen MH, Stensballe A, Varming K, Jørgensen M. Diagnostic and prognostic potential of extracellular vesicles in peripheral blood. Clin Ther 2014;36:830-46.
9. Smalley DM, Sheman NE, Nelson K, Theodorescu D. Isolation and identification of potential urinary microparticle biomarkers of bladder cancer. J Proteome Res ;7:2088-96.
10. György B, Szabó TG, Pásztói M, et al. Membrane vesicles, current state-of-the-art: emerging role of extracellular vesicles. Cell Mol Life Sci 2011;68:2667-88.
11. Raposo G, Stoorvogel W. Extracellular vesicles: exosomes, microvesicles, and friends. J Cell Biol 2013;200:373-83.
13. Antonyak MA, Li B, Boroughs LK, et al. Cancer cell-derived microvesicles induce transformation by transferring tissue transglutaminase and fibronectin to recipient cells. Proc Natl Acad Sci U S A 2011;108:4852-7.
14. Momen-Heravi F, Balaj L, Alian S, et al. Current methods for the isolation of extracellular vesicles. Biol Chem 2013;394:1253-62.
15. Harding C, Stahl P. Transferrin recycling in reticulocytes: pH and iron are important determinants of ligand binding and processing. Biochem Biophys Res Commun 1983;113:650-8.
16. Pan BT, Johnstone RM. Fate of the transferrin receptor during maturation of sheep reticulocytes in vitro: selective externalization of the receptor. Cell 1983;33:967-78.
17. Stickney Z, Losacco J, McDevitt S, Zhang Z, Lu B. Development of exosome surface display technology in living human cells. Biochem Biophys Res Commun 2016;472:53-9.
18. Zhu Q, Heon M, Zhao Z, He M. Microfluidic engineering of exosomes: editing cellular messages for precision therapeutics. Lab Chip 2018;18:1690-1703.
19. Théry C, Zitvogel L, Amigorena S. Exosomes: composition, biogenesis and function. Nat Rev Immunol 2002;2:569-79.
20. Kalluri R, LeBleu VS. function
21. Willms E, Johansson HJ, Mäger I, et al. Cells release subpopulations of exosomes with distinct molecular and biological properties. Sci Rep 2016;6:22519.
23. Al-Nedawi K, Meehan B, Micallef J, et al. Intercellular transfer of the oncogenic receptor EGFRvIII by microvesicles derived from tumour cells. Nat Cell Biol 2008;10:619-24.
24. Valadi H, Ekström K, Bossios A, Sjöstrand M, Lee JJ, Lötvall JO. Exosome-mediated transfer of mRNAs and microRNAs is a novel mechanism of genetic exchange between cells. Nat Cell Biol 2007;9:654-9.
25. Greening DW, Xu R, Ji H, Tauro BJ, Simpson RJ. A protocol for exosome isolation and characterization: evaluation of ultracentrifugation, density-gradient separation, and immunoaffinity capture methods. Methods Mol Biol 2015;1295:179-209.
26. Street JM, Koritzinsky EH, Glispie DM, Yuen PST. Urine Exosome Isolation and Characterization. Methods Mol Biol 2017;1641:413-23.
27. Helwa I, Cai J, Drewry MD, et al. A Comparative Study of Serum Exosome Isolation Using Differential Ultracentrifugation and Three Commercial Reagents. PLoS One 2017;12:e0170628.
28. Heinemann ML, Ilmer M, Silva LP, et al. Benchtop isolation and characterization of functional exosomes by sequential filtration. J Chromatogr A 2014;1371:125-35.
29. Zhao Z, Yang Y, Zeng Y, He M. A microfluidic ExoSearch chip for multiplexed exosome detection towards blood-based ovarian cancer diagnosis. Lab Chip 2016;16:489-96.
30. Li W, Li C, Zhou T, et al. Role of exosomal proteins in cancer diagnosis. Mol Cancer 2017;16:145.
31. Jackson JM, Witek MA, Hupert ML, et al. UV activation of polymeric high aspect ratio microstructures: ramifications in antibody surface loading for circulating tumor cell selection. Lab Chip 2014;14:106-17.
32. . Harshani Wijerathne, M. A. W., Mateusz L. Hupert, Joshua M. Jackson, Steven A. Soper, Microfluidic Device for EV and T-cell Isolation. 2019.
33. Woo HK, Sunkara V, Park J, et al. Exodisc for Rapid, Size-Selective, and Efficient Isolation and Analysis of Nanoscale Extracellular Vesicles from Biological Samples. ACS Nano 2017;11:1360-70.
34. Yentrapalli R, Merl-Pham J, Azimzadeh O, et al. Quantitative changes in the protein and miRNA cargo of plasma exosome-like vesicles after exposure to ionizing radiation. Int J Radiat Biol 2017;93:569-80.
35. Tian T, Zhu YL, Zhou YY, et al. Exosome uptake through clathrin-mediated endocytosis and macropinocytosis and mediating miR-21 delivery. J Biol Chem 2014;289:22258-67.
36. Fares J, Kashyap R, Zimmermann P. Syntenin: Key player in cancer exosome biogenesis and uptake? Cell Adh Migr 2017;11:124-6.
37. Hessvik NP, Llorente A. Current knowledge on exosome biogenesis and release. Cell Mol Life Sci 2018;75:193-208.
38. Tian Y, Li S, Song J, et al. A doxorubicin delivery platform using engineered natural membrane vesicle exosomes for targeted tumor therapy. Biomaterials 2014;35:2383-90.
39. Nakase I, Futaki S. Combined treatment with a pH-sensitive fusogenic peptide and cationic lipids achieves enhanced cytosolic delivery of exosomes. Sci Rep 2015;5:10112.
40. Hu L, Wickline SA, Hood JL. Magnetic resonance imaging of melanoma exosomes in lymph nodes. Magn Reson Med 2015;74:266-71.
41. Wang J, Li W, Zhang L, et al. Chemically Edited Exosomes with Dual Ligand Purified by Microfluidic Device for Active Targeted Drug Delivery to Tumor Cells. ACS Appl Mater Interfaces 2017;9:27441-52.
42. Hood JL, Scott MJ, Wickline SA. Maximizing exosome colloidal stability following electroporation. Anal Biochem 2014;448:41-9.
43. Shtam TA, Kovalev RA, Varfolomeeva EY, Makarov EM, Kil YV, Filatov MV. Exosomes are natural carriers of exogenous siRNA to human cells in vitro. Cell Commun Signal. 2013 Nov 18;11:88.
44. Wahlgren J, De L Karlson T, Brisslert M, et al. Plasma exosomes can deliver exogenous short interfering RNA to monocytes and lymphocytes. Nucleic Acids Res 2012;40:e130.
45. Besse B, Charrier M, Lapierre V, et al. Dendritic cell-derived exosomes as maintenance immunotherapy after first line chemotherapy in NSCLC. Oncoimmunology 2016;5:e1071008.
46. Viaud S, Ploix S, Lapierre V, et al. Updated technology to produce highly immunogenic dendritic cell-derived exosomes of clinical grade: a critical role of interferon-γ. J Immunother 2011;34:65-75.
47. Zhao Z, McGill J, Gamero-Kubota P, He M. Microfluidic on-demand engineering of exosomes towards cancer immunotherapy. Lab Chip 2019;19:1877-86.
48. Xu X, Lai Y, Hua ZC. Apoptosis and apoptotic body: disease message and therapeutic target potentials. Biosci Rep 2019;39:BSR20180992.
49. Hauser P, Wang S, Didenko VV. Apoptotic Bodies: Selective Detection in Extracellular Vesicles. Methods Mol Biol 2017;1554:193-200.
52. Atkin-Smith GK, Tixeira R, Paone S, et al. A novel mechanism of generating extracellular vesicles during apoptosis via a beads-on-a-string membrane structure. Nat Commun 2015;6:7439.
53. Poon IK, Lucas CD, Rossi AG, Ravichandran KS. Apoptotic cell clearance: basic biology and therapeutic potential. Nat Rev Immunol 2014;14:166-80.
54. Elliott MR, Chekeni FB, Trampont PC, et al. Nucleotides released by apoptotic cells act as a find-me signal to promote phagocytic clearance. Nature 2009;461:282-6.
55. Truman LA, Ford CA, Pasikowska M, et al. CX3CL1/fractalkine is released from apoptotic lymphocytes to stimulate macrophage chemotaxis. Blood 2008;112:5026-36.
56. Hanayama R, Tanaka M, Miwa K, Shinohara A, Iwamatsu A, Nagata S. Identification of a factor that links apoptotic cells to phagocytes. Nature 2002;417:182-7.
57. Gardai SJ, McPhillips KA, Frasch SC, et al. Cell-surface calreticulin initiates clearance of viable or apoptotic cells through trans-activation of LRP on the phagocyte. Cell 2005;123:321-34.
58. Witwer KW, Buzás EI, Bemis LT, et al. Standardization of sample collection, isolation and analysis methods in extracellular vesicle research. J Extracell Vesicles 2013;2:20360.
59. Tauro BJ, Greening DW, Mathias RA, Mathivanan S, Ji H, Simpson RJ. Two distinct populations of exosomes are released from LIM1863 colon carcinoma cell-derived organoids. Mol Cell Proteomics 2013;12:587-98.
60. Crescitelli R, Lässer C, Szabó TG, et al. Distinct RNA profiles in subpopulations of extracellular vesicles: apoptotic bodies, microvesicles and exosomes. J Extracell Vesicles 2013;2:20677.
61. Dörsam B, Reiners KS, von Strandmann EP. Cancer-derived extracellular vesicles: friend and foe of tumour immunosurveillance. Philos Trans R Soc Lond B Biol Sci 2018;373:20160481.
62. Sehrawat TS, Arab JP, Liu M, et al. Circulating Extracellular Vesicles Carrying Sphingolipid Cargo for the Diagnosis and Dynamic Risk Profiling of Alcoholic Hepatitis. Hepatology 2021;73:571-85.
63. Choi DS, Lee J, Go G, Kim YK, Gho YS. Circulating extracellular vesicles in cancer diagnosis and monitoring: an appraisal of clinical potential. Mol Diagn Ther 2013;17:265-71.
64. Yuan D, Zhao Y, Banks WA, et al. Macrophage exosomes as natural nanocarriers for protein delivery to inflamed brain. Biomaterials 2017;142:1-12.
65. Barrès C, Blanc L, Bette-Bobillo P, et al. Galectin-5 is bound onto the surface of rat reticulocyte exosomes and modulates vesicle uptake by macrophages. Blood 2010;115:696-705.
66. Lakshminarayan R, Wunder C, Becken U, et al. Galectin-3 drives glycosphingolipid-dependent biogenesis of clathrin-independent carriers. Nat Cell Biol 2014;16:595-606.
67. Merlin J, Stechly L, de Beaucé S, et al. Galectin-3 regulates MUC1 and EGFR cellular distribution and EGFR downstream pathways in pancreatic cancer cells. Oncogene 2011;30:2514-25.
68. Kim KM, Abdelmohsen K, Mustapic M, Kapogiannis D, Gorospe M. RNA in extracellular vesicles. Wiley Interdiscip Rev RNA 2017;8:e1413.
69. Batagov AO, Kurochkin IV. Exosomes secreted by human cells transport largely mRNA fragments that are enriched in the 3'-untranslated regions. Biol Direct 2013;8:12.
70. Chen YY, Lee MB, Chang CM, Liao SC. Methods of suicide in different psychiatric diagnostic groups. J Affect Disord 2009;118:196-200.
71. Mitsuhashi M, Taub DD, Kapogiannis D, et al. Aging enhances release of exosomal cytokine mRNAs by Aβ1-42-stimulated macrophages. FASEB J 2013;27:5141-50.
72. Tannous BA, Kim DE, Fernandez JL, Weissleder R, Breakefield XO. Codon-optimized Gaussia luciferase cDNA for mammalian gene expression in culture and in vivo. Mol Ther 2005;11:435-43.
73. Martellucci S, Orefice NS, Angelucci A, Luce A, Caraglia M, Zappavigna S. Extracellular Vesicles: New Endogenous Shuttles for miRNAs in Cancer Diagnosis and Therapy? Int J Mol Sci 2020;21:6486.
74. Vlaeminck-Guillem V. Extracellular Vesicles in Prostate Cancer Carcinogenesis, Diagnosis, and Management. Front Oncol 2018;8:222.
75. Huntzinger E, Izaurralde E. Gene silencing by microRNAs: contributions of translational repression and mRNA decay. Nat Rev Genet. 2011 Feb;12(2):99-110.
76. Nishida-Aoki N, Ochiya T. Interactions between cancer cells and normal cells via miRNAs in extracellular vesicles. Cell Mol Life Sci 2015;72:1849-61.
77. Mitchell PS, Parkin RK, Kroh EM, et al. Circulating microRNAs as stable blood-based markers for cancer detection. Proc Natl Acad Sci U S A 2008;105:10513-8.
78. Weber JA, Baxter DH, Zhang S, et al. The microRNA spectrum in 12 body fluids. Clin Chem 2010;56:1733-41.
79. Taylor DD, Gercel-Taylor C. MicroRNA signatures of tumor-derived exosomes as diagnostic biomarkers of ovarian cancer. Gynecol Oncol 2008;110:13-21.
80. Langhe R, Norris L, Saadeh FA, et al. A novel serum microRNA panel to discriminate benign from malignant ovarian disease. Cancer Lett 2015;356:628-36.
81. Jeppesen DK, Hvam ML, Primdahl-Bengtson B, et al. Comparative analysis of discrete exosome fractions obtained by differential centrifugation. J Extracell Vesicles 2014;3:25011.
82. Acharya SS, Fendler W, Watson J, et al. Serum microRNAs are early indicators of survival after radiation-induced hematopoietic injury. Sci Transl Med 2015;7:287ra69.
83. Tian J, Casella G, Zhang Y, Rostami A, Li X. Potential roles of extracellular vesicles in the pathophysiology, diagnosis, and treatment of autoimmune diseases. Int J Biol Sci 2020;16:620-32.
84. Jiang WY, Xun YH. [Value of detection of extracellular vesicles in the diagnosis of nonalcoholic fatty liver disease]. Zhonghua Gan Zang Bing Za Zhi 2020;28:92-6.
85. Shaimardanova AA, Solovyeva VV, Chulpanova DS, James V, Kitaeva KV, Rizvanov AA. Extracellular vesicles in the diagnosis and treatment of central nervous system diseases. Neural Regen Res 2020;15:586-96.
86. Skog J, Würdinger T, van Rijn S, et al. Glioblastoma microvesicles transport RNA and proteins that promote tumour growth and provide diagnostic biomarkers. Nat Cell Biol 2008;10:1470-6.
87. Vlassov AV, Magdaleno S, Setterquist R, Conrad R. Exosomes: current knowledge of their composition, biological functions, and diagnostic and therapeutic potentials. Biochim Biophys Acta 2012;1820:940-8.
88. Aziz N, Detels R, Quint JJ, Li Q, Gjertson D, Butch AW. Stability of cytokines, chemokines and soluble activation markers in unprocessed blood stored under different conditions. Cytokine 2016;84:17-24.
89. Johnsen KB, Gudbergsson JM, Andresen TL, Simonsen JB. What is the blood concentration of extracellular vesicles? Biochim Biophys Acta Rev Cancer 2019;1871:109-16.
90. Ruhen O, Meehan K. Tumor-Derived Extracellular Vesicles as a Novel Source of Protein Biomarkers for Cancer Diagnosis and Monitoring. Proteomics 2019;19:e1800155.
91. Brenner AW, Su GH, Momen-Heravi F. Isolation of Extracellular Vesicles for Cancer Diagnosis and Functional Studies. Methods Mol Biol 2019;1882:229-37.
92. Zhang Q, Bansal A. Role of Extracellular Vesicles in the Diagnosis and Pathogenesis of Barrett's Esophagus: A Mini-Review. Dig Dis Sci 2021;66:705-13.
93. Rahbarghazi R, Jabbari N, Sani NA, et al. Tumor-derived extracellular vesicles: reliable tools for Cancer diagnosis and clinical applications. Cell Commun Signal 2019;17:73.
94. Kawikova I, Askenase PW. Diagnostic and therapeutic potentials of exosomes in CNS diseases. Brain Res 2015;1617:63-71.
95. Masyuk AI, Masyuk TV, Larusso NF. Exosomes in the pathogenesis, diagnostics and therapeutics of liver diseases. J Hepatol 2013;59:621-5.
96. Spanu S, van Roeyen CR, Denecke B, Floege J, Mühlfeld AS. Urinary exosomes: a novel means to non-invasively assess changes in renal gene and protein expression. PLoS One 2014;9:e109631.
97. Couch Y, Akbar N, Davis S, et al. Inflammatory Stroke Extracellular Vesicles Induce Macrophage Activation. Stroke 2017;48:2292-6.
98. Levänen B, Bhakta NR, Torregrosa Paredes P, et al. Altered microRNA profiles in bronchoalveolar lavage fluid exosomes in asthmatic patients. J Allergy Clin Immunol 2013;131:894-903.
99. Hoefer IE, Steffens S, Ala-Korpela M, et al. ESC Working Group Atherosclerosis and Vascular Biology. Novel methodologies for biomarker discovery in atherosclerosis. Eur Heart J 2015;36:2635-42.
100. Weng Y, Sui Z, Shan Y, et al. Effective isolation of exosomes with polyethylene glycol from cell culture supernatant for in-depth proteome profiling. Analyst 2016;141:4640-6.
101. Atha DH, Ingham KC. Mechanism of precipitation of proteins by polyethylene glycols. Analysis in terms of excluded volume. J Biol Chem 1981;256:12108-17.
102. Andreu Z, Rivas E, Sanguino-Pascual A, et al. Comparative analysis of EV isolation procedures for miRNAs detection in serum samples. J Extracell Vesicles 2016;5:31655.
103. Li P, Kaslan M, Lee SH, Yao J, Gao Z. Progress in Exosome Isolation Techniques. Theranostics 2017;7:789-804.
104. Salih M, Zietse R, Hoorn EJ. Urinary extracellular vesicles and the kidney: biomarkers and beyond. Am J Physiol Renal Physiol 2014;306:F1251-9.
105. Taylor DD, Zacharias W, Gercel-Taylor C. Exosome isolation for proteomic analyses and RNA profiling. Methods Mol Biol 2011;728:235-46.
106. Lamparski HG, Metha-damani A, Yao J, et al. Production and characterization of clinical grade exosomes derived from dendritic cells. J Immunol Methods 2002;270:211-26.
107. Li X, Corbett AL, Taatizadeh E, et al. Challenges and opportunities in exosome research-Perspectives from biology, engineering, and cancer therapy. APL Bioeng 2019;3:011503.
108. Tauro BJ, Greening DW, Mathias RA, et al. Comparison of ultracentrifugation, density gradient separation, and immunoaffinity capture methods for isolating human colon cancer cell line LIM1863-derived exosomes. Methods 2012;56:293-304.
109. Théry C, Amigorena S, Raposo G, Clayton A. Isolation and characterization of exosomes from cell culture supernatants and biological fluids. Curr Protoc Cell Biol 2006;Chapter 3:Unit 3.22.
110. Sunkara V, Woo HK, Cho YK. Emerging techniques in the isolation and characterization of extracellular vesicles and their roles in cancer diagnostics and prognostics. Analyst 2016;141:371-81.
111. Yoo YK, Lee J, Kim H, Hwang KS, Yoon DS, Lee JH. Toward Exosome-Based Neuronal Diagnostic Devices. Micromachines (Basel) 2018;9:634.
112. Konoshenko MY, Lekchnov EA, Vlassov AV, Laktionov PP. Isolation of Extracellular Vesicles: General Methodologies and Latest Trends. Biomed Res Int 2018;2018:8545347.
113. Livshits MA, Khomyakova E, Evtushenko EG, et al. Isolation of exosomes by differential centrifugation: Theoretical analysis of a commonly used protocol. Sci Rep 2015;5:17319.
114. Abramowicz A, Widlak P, Pietrowska M. Proteomic analysis of exosomal cargo: the challenge of high purity vesicle isolation. Mol Biosyst 2016;12:1407-19.
115. Alvarez ML, Khosroheidari M, Kanchi Ravi R, DiStefano JK. Comparison of protein, microRNA, and mRNA yields using different methods of urinary exosome isolation for the discovery of kidney disease biomarkers. Kidney Int 2012;82:1024-32.
116. Takov K, Yellon DM, Davidson SM. Comparison of small extracellular vesicles isolated from plasma by ultracentrifugation or size-exclusion chromatography: yield, purity and functional potential. J Extracell Vesicles 2019;8:1560809.
117. Buschmann D, Kirchner B, Hermann S, et al. Evaluation of serum extracellular vesicle isolation methods for profiling miRNAs by next-generation sequencing. J Extracell Vesicles 2018;7:1481321.
118. Ding M, Wang C, Lu X, et al. Comparison of commercial exosome isolation kits for circulating exosomal microRNA profiling. Anal Bioanal Chem 2018;410:3805-14.
119. Whiteside TL. Tumor-Derived Exosomes and Their Role in Tumor-Induced Immune Suppression. Vaccines (Basel) 2016;4:35.
120. Ayala-Mar S, Donoso-Quezada J, Gallo-Villanueva RC, Perez-Gonzalez VH, González-Valdez J. Recent advances and challenges in the recovery and purification of cellular exosomes. Electrophoresis 2019;40:3036-49.
121. Serrano-Pertierra E, Oliveira-Rodríguez M, Rivas M, et al. Characterization of Plasma-Derived Extracellular Vesicles Isolated by Different Methods: A Comparison Study. Bioengineering (Basel) 2019;6:8.
122. Cvjetkovic A, Lötvall J, Lässer C. The influence of rotor type and centrifugation time on the yield and purity of extracellular vesicles. J Extracell Vesicles 2014;3:23111.
123. Zhang P, He M, Zeng Y. Ultrasensitive microfluidic analysis of circulating exosomes using a nanostructured graphene oxide/polydopamine coating. Lab Chip 2016;16:3033-42.
124. Kanwar SS, Dunlay CJ, Simeone DM, Nagrath S. Microfluidic device (ExoChip) for on-chip isolation, quantification and characterization of circulating exosomes. Lab Chip 2014;14:1891-900.
125. Reátegui E, van der Vos KE, Lai CP, et al. Engineered nanointerfaces for microfluidic isolation and molecular profiling of tumor-specific extracellular vesicles. Nat Commun 2018;9:175.
126. Dudani JS, Gossett DR, Tse HT, Lamm RJ, Kulkarni RP, Carlo DD. Rapid inertial solution exchange for enrichment and flow cytometric detection of microvesicles. Biomicrofluidics 2015;9:014112.
127. Liu C, Guo J, Tian F, et al. Field-Free Isolation of Exosomes from Extracellular Vesicles by Microfluidic Viscoelastic Flows. ACS Nano 2017;11:6968-76.
128. Wu M, Ouyang Y, Wang Z, et al. Isolation of exosomes from whole blood by integrating acoustics and microfluidics. Proc Natl Acad Sci U S A 2017;114:10584-9.
129. Zhang P, Zhou X, He M, et al. Ultrasensitive detection of circulating exosomes with a 3D-nanopatterned microfluidic chip. Nat Biomed Eng 2019;3:438-51.
130. He M, Crow J, Roth M, Zeng Y, Godwin AK. Integrated immunoisolation and protein analysis of circulating exosomes using microfluidic technology. Lab Chip 2014;14:3773-80.
131. Kang YT, Purcell E, Palacios-Rolston C, et al. Isolation and Profiling of Circulating Tumor-Associated Exosomes Using Extracellular Vesicular Lipid-Protein Binding Affinity Based Microfluidic Device. Small 2019;15:e1903600.
132. Zhang J, Huang H, Xue L, et al. On-demand drug release nanoplatform based on fluorinated aza-BODIPY for imaging-guided chemo-phototherapy. Biomaterials 2020;256:120211.
133. Haney MJ, Klyachko NL, Zhao Y, et al. Exosomes as drug delivery vehicles for Parkinson's disease therapy. J Control Release 2015;207:18-30.
134. El-Andaloussi S, Lee Y, Lakhal-Littleton S, et al. Exosome-mediated delivery of siRNA in vitro and in vivo. Nat Protoc 2012;7:2112-26.
135. Ko J, Carpenter E, Issadore D. Detection and isolation of circulating exosomes and microvesicles for cancer monitoring and diagnostics using micro-/nano-based devices. Analyst 2016;141:450-60.
137. ONeil CE, Jackson JM, Shim SH, Soper SA. Interrogating Surface Functional Group Heterogeneity of Activated Thermoplastics Using Super-Resolution Fluorescence Microscopy. Anal Chem 2016;88:3686-96.
138. O'Neil CE, Taylor S, Ratnayake K, Pullagurla S, Singh V, Soper SA. Characterization of activated cyclic olefin copolymer: effects of ethylene/norbornene content on the physiochemical properties. Analyst 2016;141:6521-32.
139. Wijerathne H, Witek MA, Jackson JM, et al. Affinity enrichment of extracellular vesicles from plasma reveals mRNA changes associated with acute ischemic stroke. Commun Biol 2020;3:613.
140. Enderle D, Spiel A, Coticchia CM, et al. Characterization of RNA from Exosomes and Other Extracellular Vesicles Isolated by a Novel Spin Column-Based Method. PLoS One 2015;10:e0136133.
141. Haque S, Vaiselbuh SR. Exosomes molecular diagnostics: Direct conversion of exosomes into the cDNA for gene amplification by two-step polymerase chain reaction. J Biol Methods 2018;5:e96.
142. Soo CY, Song Y, Zheng Y, et al. Nanoparticle tracking analysis monitors microvesicle and exosome secretion from immune cells. Immunology 2012;136:192-7.
143. Vestad B, Llorente A, Neurauter A, et al. Size and concentration analyses of extracellular vesicles by nanoparticle tracking analysis: a variation study. J Extracell Vesicles 2017;6:1344087.
144. Gardiner C, Ferreira YJ, Dragovic RA, Redman CW, Sargent IL. Extracellular vesicle sizing and enumeration by nanoparticle tracking analysis. J Extracell Vesicles 2013;2:19671.
145. Gross J, Sayle S, Karow AR, Bakowsky U, Garidel P. Nanoparticle tracking analysis of particle size and concentration detection in suspensions of polymer and protein samples: Influence of experimental and data evaluation parameters. Eur J Pharm Biopharm 2016;104:30-41.
146. Filipe V, Hawe A, Jiskoot W. Critical evaluation of Nanoparticle Tracking Analysis (NTA) by NanoSight for the measurement of nanoparticles and protein aggregates. Pharm Res 2010;27:796-810.
147. Maas SL, de Vrij J, van der Vlist EJ, et al. Possibilities and limitations of current technologies for quantification of biological extracellular vesicles and synthetic mimics. J Control Release 2015;200:87-96.
148. . Ludwig Reimer, HK, Transmission Electron Microscopy: Physics of Image Formation. Springer: 2008; p. 487.
149. Peak TC, Praharaj PP, Panigrahi GK, et al. Exosomes secreted by placental stem cells selectively inhibit growth of aggressive prostate cancer cells. Biochem Biophys Res Commun 2018;499:1004-10.
150. Shao H, Chung J, Balaj L, et al. Protein typing of circulating microvesicles allows real-time monitoring of glioblastoma therapy. Nat Med 2012;18:1835-40.
151. Enderle D, Spiel A, Coticchia CM, et al. Characterization of RNA from Exosomes and Other Extracellular Vesicles Isolated by a Novel Spin Column-Based Method. PLoS One 2015;10:e0136133.
152. Koifman N, Biran I, Aharon A, Brenner B, Talmon Y. A direct-imaging cryo-EM study of shedding extracellular vesicles from leukemic monocytes. J Struct Biol 2017;198:177-85.
153. Cizmar P, Yuana Y. Detection and Characterization of Extracellular Vesicles by Transmission and Cryo-Transmission Electron Microscopy. Methods Mol Biol 2017;1660:221-232.
154. Buzas EI, György B, Nagy G, Falus A, Gay S. Emerging role of extracellular vesicles in inflammatory diseases. Nat Rev Rheumatol 2014;10:356-64.
155. Sharma S, Gillespie BM, Palanisamy V, Gimzewski JK. Quantitative nanostructural and single-molecule force spectroscopy biomolecular analysis of human-saliva-derived exosomes. Langmuir 2011;27:14394-400.
156. Yuana Y, Oosterkamp TH, Bahatyrova S, et al. Atomic force microscopy: a novel approach to the detection of nanosized blood microparticles. J Thromb Haemost 2010;8:315-23.
157. van der Pol E, Coumans FA, Grootemaat AE, et al. Particle size distribution of exosomes and microvesicles determined by transmission electron microscopy, flow cytometry, nanoparticle tracking analysis, and resistive pulse sensing. J Thromb Haemost 2014;12:1182-92.
158. Nolan JP, Jones JC. Detection of platelet vesicles by flow cytometry. Platelets 2017;28:256-62.
159. Szatanek R, Baj-Krzyworzeka M, Zimoch J, Lekka M, Siedlar M, Baran J. The Methods of Choice for Extracellular Vesicles (EVs) Characterization. Int J Mol Sci 2017;18:1153.
160. Baj-Krzyworzeka M, Szatanek R, Weglarczyk K, et al. Tumour-derived microvesicles carry several surface determinants and mRNA of tumour cells and transfer some of these determinants to monocytes. Cancer Immunol Immunother 2006;55:808-18.
161. Zhang J, Li S, Li L, et al. Exosome and exosomal microRNA: trafficking, sorting, and function. Genomics Proteomics Bioinformatics 2015;13:17-24.
162. Morales-Kastresana A, Jones JC. Flow Cytometric Analysis of Extracellular Vesicles. Methods Mol Biol 2017;1545:215-225.
163. Suárez H, Gámez-Valero A, Reyes R, et al. A bead-assisted flow cytometry method for the semi-quantitative analysis of Extracellular Vesicles. Sci Rep 2017;7:11271.
164. Friedrich R, Block S, Alizadehheidari M, et al. A nano flow cytometer for single lipid vesicle analysis. Lab Chip 2017;17:830-41.
165. Koritzinsky EH, Street JM, Star RA, Yuen PS. Quantification of Exosomes. J Cell Physiol 2017;232:1587-90.
166. DeBlois RW, Wesley RK. Sizes and concentrations of several type C oncornaviruses and bacteriophage T2 by the resistive-pulse technique. J Virol 1977;23:227-33.
167. Deblois RW, Uzgiris EE, Cluxton DH, Mazzone HM. Comparative measurements of size and polydispersity of several insect viruses. Analytical Biochemistry 1978;90:273-88.
168. Kasianowicz JJ, Brandin E, Branton D, Deamer DW. Characterization of individual polynucleotide molecules using a membrane channel. Proc Natl Acad Sci U S A 1996;93:13770-3.
169. Astier Y, Braha O, Bayley H. Toward single molecule DNA sequencing: direct identification of ribonucleoside and deoxyribonucleoside 5'-monophosphates by using an engineered protein nanopore equipped with a molecular adapter. J Am Chem Soc 2006;128:1705-10.
170. Deamer DW, Akeson M. Nanopores and nucleic acids: prospects for ultrarapid sequencing. Trends in Biotechnology 2000;18:147-51.
171. Lobb RJ, Becker M, Wen SW, et al. Optimized exosome isolation protocol for cell culture supernatant and human plasma. J Extracell Vesicles 2015;4:27031.
172. Anderson W, Lane R, Korbie D, Trau M. Observations of Tunable Resistive Pulse Sensing for Exosome Analysis: Improving System Sensitivity and Stability. Langmuir 2015;31:6577-87.
173. Kozak D, Anderson W, Vogel R, Trau M. Advances in Resistive Pulse Sensors: Devices bridging the void between molecular and microscopic detection. Nano Today 2011;6:531-45.
174. Lan W, Kubeil C, Xiong J, Bund A, White HS. Effect of Surface Charge on the Resistive Pulse Waveshape during Particle Translocation through Glass Nanopores. J Phys Chem C 2014;118:2726-34.
175. Pan R, Hu K, Jiang D, Samuni U, Mirkin MV. Electrochemical Resistive-Pulse Sensing. J Am Chem Soc 2019;141:19555-9.
176. Wu Y, Benson JD, Critser JK, Almasri M. MEMS-based Coulter counter for cell counting and sizing using multiple electrodes. J Micromech Microeng 2010;20:085035.
177. Jagtiani AV, Zhe J, Hu J, Carletta. Detection and counting of micro-scale particles and pollen using a multi-aperture Coulter counter. Meas Sci Technol 2006;17:1706-14.
178. Zhe J, Jagtiani A, Dutta P, Hu J, Carletta J. A micromachined high throughput Coulter counter for bioparticle detection and counting. J Micromech Microeng 2007;17:304-13.
179. Jagtiani AV, Carletta J, Zhe J. An impedimetric approach for accurate particle sizing using a microfluidic Coulter counter. J Micromech Microeng 2011;21:045036.
180. Lannigan J, Erdbruegger U. Imaging flow cytometry for the characterization of extracellular vesicles. Methods 2017;112:55-67.
181. Rosenstein JK, Wanunu M, Merchant CA, Drndic M, Shepard KL. Integrated nanopore sensing platform with sub-microsecond temporal resolution. Nat Methods 2012;9:487-92.
182. Li J, Stein D, McMullan C, Branton D, Aziz MJ, Golovchenko JA. Ion-beam sculpting at nanometre length scales. Nature 2001;412:166-9.
184. Song Y, Zhang J, Li D. Microfluidic and Nanofluidic Resistive Pulse Sensing: A Review. Micromachines (Basel) 2017;8:204.
185. Vaclavek T, Prikryl J, Foret F. Resistive pulse sensing as particle counting and sizing method in microfluidic systems: Designs and applications review. J Sep Sci 2019;42:445-57.
186. Cui S, Cheng Z, Qin W, Jiang L. Exosomes as a liquid biopsy for lung cancer. Lung Cancer 2018;116:46-54.
187. Mader S, Pantel K. Liquid Biopsy: Current Status and Future Perspectives. Oncol Res Treat 2017;40:404-8.
189. Chen M, Zhao H. Next-generation sequencing in liquid biopsy: cancer screening and early detection. Hum Genomics 2019;13:34.
190. Manna I, Iaccino E, Dattilo V, et al. Exosome-associated miRNA profile as a prognostic tool for therapy response monitoring in multiple sclerosis patients. FASEB J 2018;32:4241-6.
191. Alimirzaie S, Bagherzadeh M, Akbari MR. Liquid biopsy in breast cancer: A comprehensive review. Clin Genet 2019;95:643-60.
192. Vader P, Mol EA, Pasterkamp G, Schiffelers RM. Extracellular vesicles for drug delivery. Adv Drug Deliv Rev 2016;106:148-56.
193. Batrakova EV, Kim MS. Using exosomes, naturally-equipped nanocarriers, for drug delivery. J Control Release 2015;219:396-405.
194. Li P, Kaslan M, Lee SH, Yao J, Gao Z. Progress in Exosome Isolation Techniques. Theranostics 2017;7:789-804.
195. Konoshenko MY, Lekchnov EA, Vlassov AV, Laktionov PP. Isolation of Extracellular Vesicles: General Methodologies and Latest Trends. Biomed Res Int 2018;2018:8545347.
196. Livshits MA, Khomyakova E, Evtushenko EG, et al. Isolation of exosomes by differential centrifugation: Theoretical analysis of a commonly used protocol. Sci Rep 2015;5:17319.
197. Deun J, Mestdagh P, Agostinis P, et al; EV-TRACK Consortium. EV-TRACK: transparent reporting and centralizing knowledge in extracellular vesicle research. Nat Methods 2017;14:228-32.
198. Tang YT, Huang YY, Zheng L, et al. Comparison of isolation methods of exosomes and exosomal RNA from cell culture medium and serum. Int J Mol Med 2017;40:834-44.
199. Chen BY, Sung CW, Chen C, et al. Advances in exosomes technology. Clin Chim Acta 2019;493:14-9.
200. Nath Neerukonda S, Egan NA, Patria J, et al. Comparison of exosomes purified via ultracentrifugation (UC) and Total Exosome Isolation (TEI) reagent from the serum of Marek's disease virus (MDV)-vaccinated and tumor-bearing chickens. J Virol Methods 2019;263:1-9.
201. Lee K, Shao H, Weissleder R, Lee H. Acoustic purification of extracellular microvesicles. ACS Nano 2015;9:2321-7.
Cite This Article
Export citation file: BibTeX | RIS
OAE Style
Zhao Z, Wijerathne H, Godwin AK, Soper SA. Isolation and analysis methods of extracellular vesicles (EVs). Extracell Vesicles Circ Nucleic Acids 2021;2:80-103. http://dx.doi.org/10.20517/evcna.2021.07
AMA Style
Zhao Z, Wijerathne H, Godwin AK, Soper SA. Isolation and analysis methods of extracellular vesicles (EVs). Extracellular Vesicles and Circulating Nucleic Acids. 2021; 2(1): 80-103. http://dx.doi.org/10.20517/evcna.2021.07
Chicago/Turabian Style
Zhao, Zheng, Harshani Wijerathne, Andrew K. Godwin, Steven A. Soper. 2021. "Isolation and analysis methods of extracellular vesicles (EVs)" Extracellular Vesicles and Circulating Nucleic Acids. 2, no.1: 80-103. http://dx.doi.org/10.20517/evcna.2021.07
ACS Style
Zhao, Z.; Wijerathne H.; Godwin AK.; Soper SA. Isolation and analysis methods of extracellular vesicles (EVs). Extracell. Vesicles. Circ. Nucleic. Acids. 2021, 2, 80-103. http://dx.doi.org/10.20517/evcna.2021.07
About This Article
Copyright

Data & Comments
Data


 Cite This Article 81 clicks

 Like This Article 9
likes
Like This Article 9
likes


Comments
Comments must be written in English. Spam, offensive content, impersonation, and private information will not be permitted. If any comment is reported and identified as inappropriate content by OAE staff, the comment will be removed without notice. If you have any queries or need any help, please contact us at support@oaepublish.com.